|
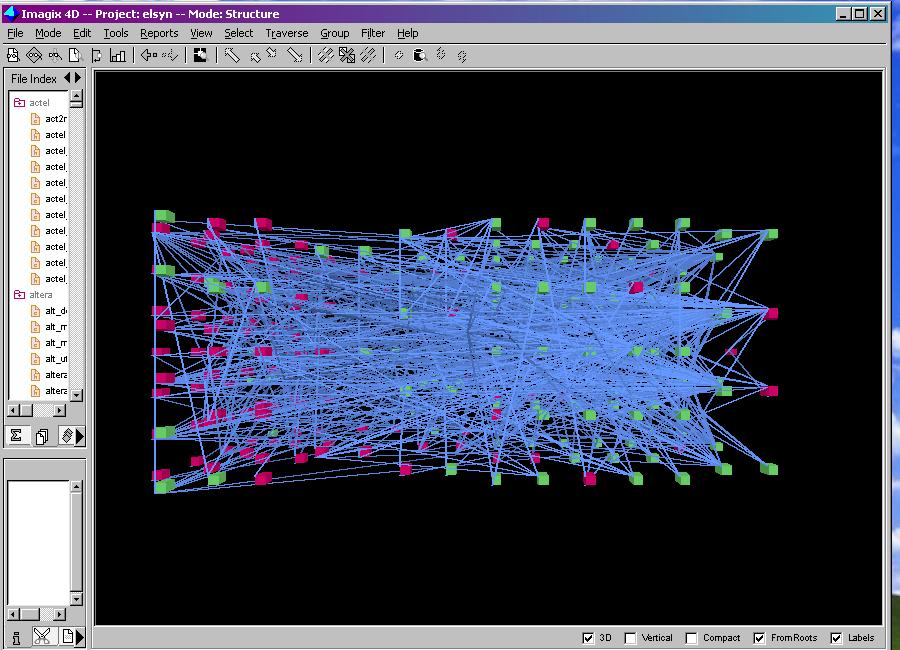
Coloring the Coverage Call TreeProblem:For those who have done code coverage for their products, this will be a common problem. You have a thick report of coverage data, listing every function and whether it is hit as well as cumulative results by directories and modules. What is missing is an objective way to prioritize which functions should be covered for the next set of testcases to be developed. Solution:What is missing is a way to view the coverage results in the context of the call tree, so that we can identify the "tops" of the uncovered forest of functions. In the illustrative example below, the coverage tool used is PureCoverage for Windows, and the call tree tool used is Imagix. Imagix worked with me to provide a script to read the Purecov report and color the Imagix call tree - nodes that are hit green and the unhit ones red. Example:This picture shows the 3-D view of the entire call tree.
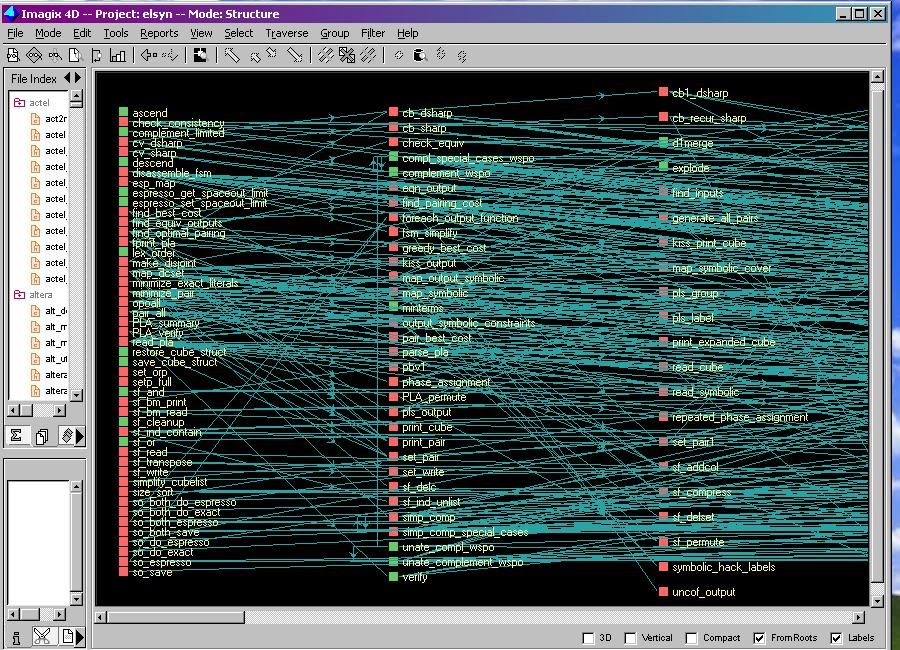
Imagix allows an alternative 2-D view as well. In this view, the leftmost red nodes are the "tops" of the uncovered forest of functions.
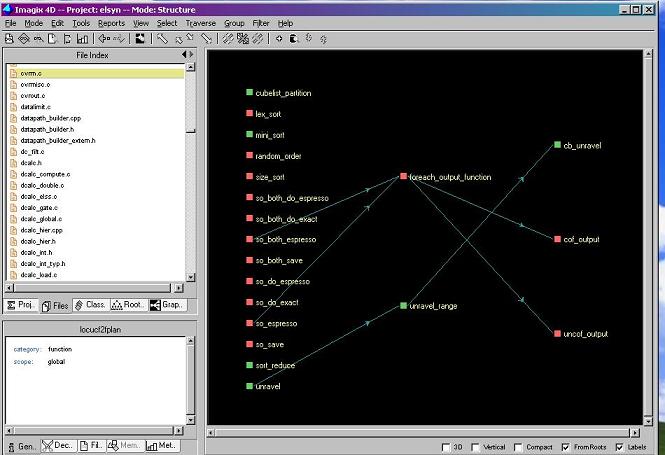
Once identified, other views of the call trees such as this one, based on a given file can be used to provide information for the developer to write the testcase needed to hit the specific function.
|