|
Graph-based Software Production AutomationIntroductionA basic high level goal of Software Production Automation is to have a single point of control to perform all the tasks necessary for production. Typically, these include the steps to :
Each of these steps may be in a different state of automation. Some are purely manual, others are automated with scripts but assume manual prechecking of their dependencies, etc. Many scripts may not verify their output, even if strung along with other tools. These steps may be developed by different engineers, and in different states of readiness. Some steps have been performed by one engineer for so long that they don't work when performed using another account. The build steps have to be repeated across the required range of build platforms. Since one build platform, say Windows XP has to be tested against several test platforms, eg Windows 2000, Windows XP and Windows Vista, the test steps are similarly scaled. Theoretically, all the build and test platforms can be parallelized. However, depending on circumstances, adjustments may have to be made. Examples include :
In summary, the complexity of such a system comes from the need to
FeaturesThis showcase paper describes a graph-based software automation system that encapsulates disparate process steps using a consistent "step" methodology. Each "step" allows for pre and post work, and allows hooks for executing scripts or Perl functions. The step methodology is intended as a guideline, ie existing scripts that do not have post operations for example, can be integrated first, and the post operations added later. These process steps can be flexibly assembled into subgraphs and graphs, thereby making their run dependencies explicit. Process activity can be developed piecemeal as subgraphs and then assembled into a large graph. The final graph then provides the single point of view and control. Other graphs can be tailored for other purposes - eg a purely debugged build and test, etc.The automation system provides capabilities to run/stop/bypass arbitary points in any graph or subgraph, and to debug and restart failed steps. Execution of each step is implemented for rsh and the Sun Grid Engine (SGE). For Unix platforms, both rsh and SGE modes are available. For Windows, only rsh mode is available. During execution, the steps will be colored to show their state - notStarted, Done, Failed, etc. For more details, see the State Transition Diagram for Graph Nodes. As each step is executed, process metrics such as runtime and disk used are collected in a consistent manner. This allows the process itself to be analyzed and trends identified. Thus, the graph is not only used for visualization of the process, its dependencies and run status, but is also the input for the automation system itself. Illustrative GraphBelow is a sanitized, yet illustrative sample Production graph. Each of the subgraphs such as "Sync and Build" was developed and tested individually and then assembled. Click on each subgraph to bring up a more detailed window of the graph. If your browser is not IE7, there may be some reduced functionality. 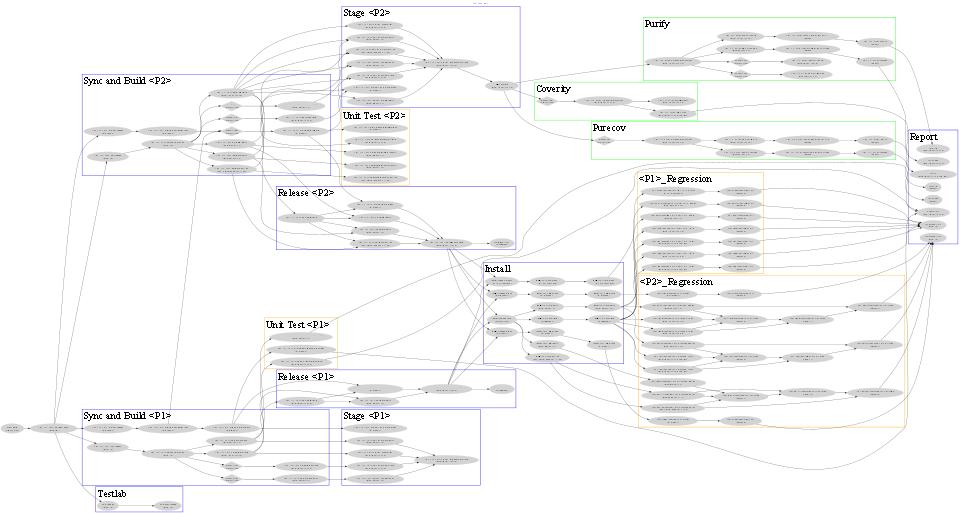
State Transition Diagram for Graph NodesThis diagram shows the state transitions for a "step" in the graph. Overlayed on top are colors used to show the states for easy visual feedback. 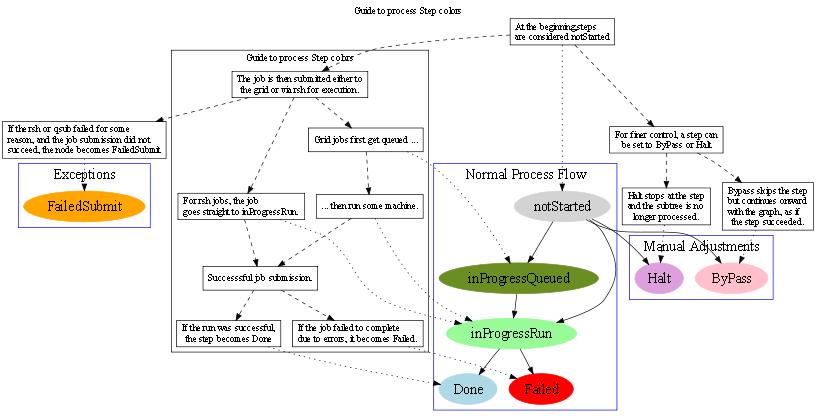
Supporting PracticesA fully working Software Production system cannot just rely on technology. Other supporting practices need to be brought to bear so as to keep the inputs and environments of the automated system consistent and reliable. Some of these supporting practices include :
ImplementationThe open-source Graphviz project provides a standard format for describing graphs, and some basic tools to view and manipulate them. For very large graphs, more advanced viewers such as ZGRViewer are also available. The process graphs are described in the Graphviz .dot format. The software automation system is implemented with Perl. The .dot graphs are manipulated with the Graph package. The single point of configuration is enabled using the Perl Config:Scoped package. The format of the configuration files is simple enough for non Perl tools, yet flexible for internal Perl usage. |