|
Do you know what your testcases are doing?Testcase runs contain a wealth of information that usually go unused. -- Anon IntroductionIn a typical software cycle, testing is focused on the current build - identifying testcases that fail and iterating the fix-build-test cycle as quickly as possible until all the testcases are passing or the known failures can be accounted for. In certain crunch situations, only the failing tests are rerun; the risk being ameliorated with a full confirmation run once all the fixes are in. Have you always wanted to have a higher level view of your testcases? Imagine if you had a bird's eye view of how your testcases perform, for each build number, and for each platform that the testcase runs. Something like the HTML page below : 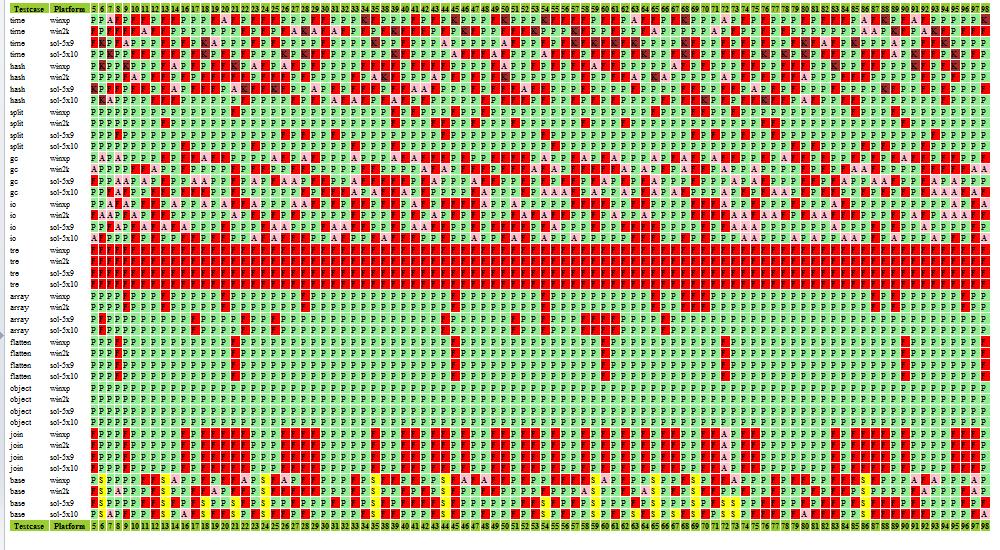

Even without knowing the details, except for the key for testcase results above, we can see useful patterns in our set of runs that would not be obvious with a “per build” point of view. Patterns that identify problematic testcases, those that always pass or always fail, etc. What if I were to tell you that the information to generate the diagram is already available in your test run results and all you need is a tool and some customization to get this higher level of information? Selective visualizationFor clarity and completeness, a more readable portion of the HTML is reproduced below : 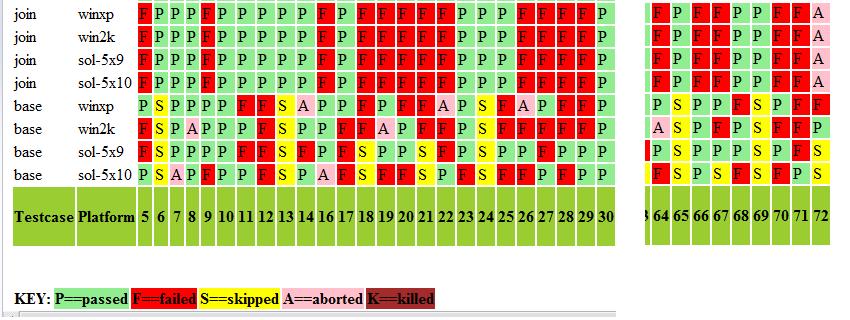
By commenting out selective parts of the style sheet, we can focus our view on specific states. For example, to view only the failed testcases, we edit the style sheet as show below:
  # Colors for testcaseresult states
  # .tc-P {background-color:lightgreen}
 .tc-F {background-color:red}
  # .tc-S {background-color:yellow}
  # .tc-A {background-color:pink}
  # .tc-K {background-color:brown}
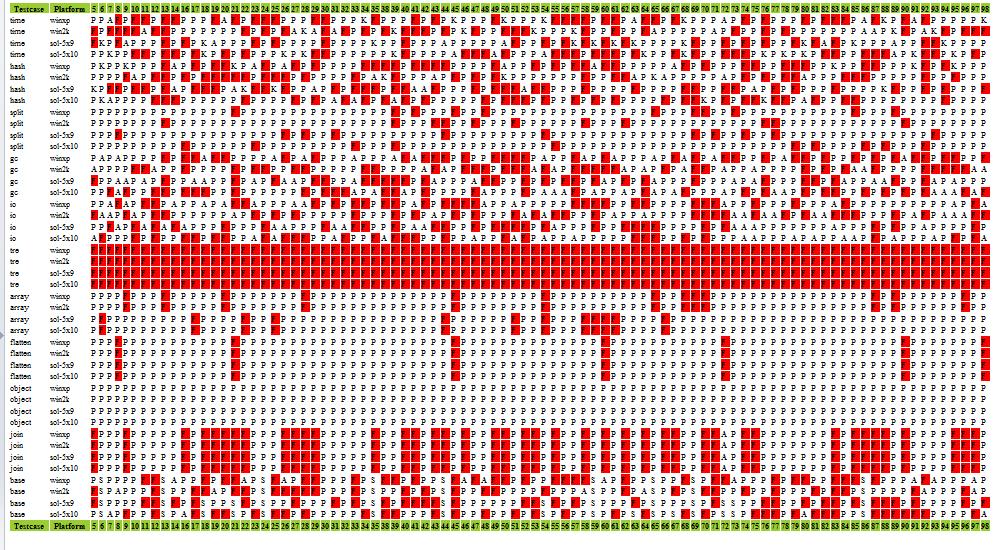
Similarly, to show just the aborted and killed testcases, we have : 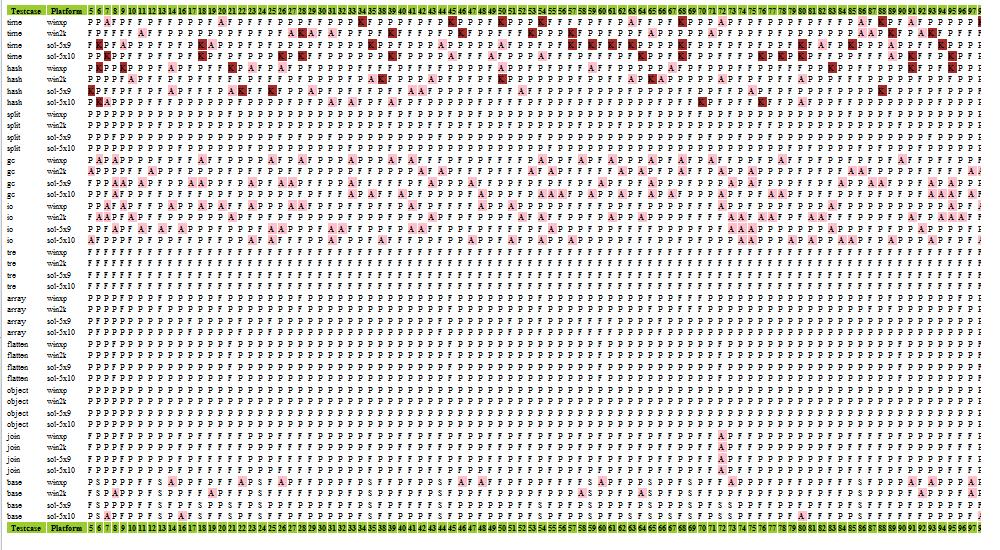
Intermittent testcasesFour patterns will stand out quite readily. These are :
For illustrative purposes, let's consider the testcase result state of “failed”. An example of “always failed” would be the testcase “tre”, on all 4 platforms. 
An example of “never failed” would be testcase “object”, again on all 4 platforms. The testcase “join” shows a “sometimes failed, pattern seen” because failures always occur across all 4 platforms. 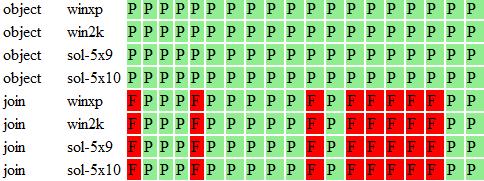
Lastly, the testcase “time” shows “sometimes failed, no obvious pattern”. 
Intermittent failures, aborts etc can point to environment dependencies that a testcase is oblivious of. These dependencies can range from disk space and third party licenses to conflicts with other weekly cleanup tools etc. The net effect is a “drag” or “friction” on the software testing process because they entail time and effort to repeatedly check out. The key point is that these situations can be investigated and testcase updated to detect the specific dependencies, saving future work. There's only so much you can learn by looking at other people's data. So, let's move on to a description of my tool and how you can customize it to generate HTML output based on your own testcase runs. Format for testcase resultFor flexibility, I've based the input format on YAML because it is a simple, portable language for storing data. This format is human readable and supported by many open source tools. Thus, a testcase result record looks like this, in YAML :
  ---
  buildNum: 38
  machineName: sun1
  runDuration: 22732
  runStatus: P
  startDateTime: 2008-11-01 16:00:00
  testcaseName: array
By using YAML, it frees you to decide how you want to generate this output. You could augment your existing test driver or shell, or you could use Perl's YAML package or Ruby's YAML module, etc. Below is a table describing the record fields.
How to use the toolLet's say you've unzipped the tool distribution and placed your testcaseresults in the directory <distribution>/test/data1. f:\projects\testcaseGraph\test>ls data1 2007-11-01.yaml 2007-11-02.yaml Let's say you want to put the output html in data1/x.htm and the output style sheet in data1/x.css. You can use the shell helper script, genHtml.bat as follows:
 f:\projects\testcaseGraph\test>genHtml.bat data1/x.htm data1/x.css data1/*.yaml
 yamlFile=data1/2007-11-01.yaml
 yamlFile=data1/2007-11-02.yaml
 WARN: 286 discrepancies detected.
You can now view the data1/x.htm. Also, if you peek inside genHtml.bat, you can see how to make the ruby call directly :
 f:\projects\testcaseGraph\test>ruby genHtml.rb data1/x.htm data1/x.css data1/*.yaml
 yamlFile=data1/2007-11-01.yaml
 yamlFile=data1/2007-11-02.yaml
 WARN: 286 discrepancies detected.
Tool implementation and User customizationThe tool is implemented in Ruby. Although I developed the tool on Windows, the use of Ruby means you can easily use it on Linux or other Unix platforms as is. There are 3 object classes ( TestcaseResult, TestcaseUtils, TestcaseHtml ) that the tool makes use of. Each of these classes is implemented in their respective .rb file, with the names being lower-cased. This is a Ruby convention.
Each of these classes can be configured. For consistency, the configuration files are named Thus, the class TestcaseResult is implemented in the file testcaseresult.rb and its configuration is defined in testcaseresult.config.yaml. File : testcaseutils.config.yamlThis file allows you to configure the mapping between the machines that you have, and the platforms identifiers that you use. In the example below, the machines “sun1”, “sun2”, “sun3” and “sun4” maps to 2 different solaris OS, 5.9 and 5.10. Similarly we have 2 winxp machines and 1 win2k machine. # If machines have a consistent naming convention, the # function machineToPlatform can be updated accordingly, # and to use the hash as the last resort # In effect, PLAT[<machine>]=<platform> PLAT: sun1: sol-5x9 sun2: sol-5x10 sun3: sol-5x10 sun4: sol-5x10 win2k1: win2k winxp1: winxp winxp2: winxp File : testcaseresults.config.yaml
 ---
 # Define the different states a testcase can be classified into.
 # This can be site or project specific
 STATEHASH:
   passed:  P
   failed:  F
   skipped: S
   aborted: A
   killed:  K

 # Define the ordering of testcase state, from lowest to highest
 # This allows the STATEHASH above to be order-independent
 STATEARRAY:
 - P
 - F
 - S
 - A
 - K

 # Define the colors associated with each state
 STATECOLOR:
   P: lightgreen
   F: red
   S: yellow
   A: pink
   K: brown
The STATEHASH, STATEARRAY and STATECOLOR can be configured to match your site's definition of testcase results. File : testcasehtml.config.yamlIdeally, when the tool reads in the testcase result records, each record is unique. However, there may be situations where the same (testcase,plat,buildnum) appears several times. This can be due to re-runs or combining several runs together. testcasehtml.config.yaml contains the policies you can set to respond to this situation. You configure the “conflictreaction” to issue a warning each time the same (testcase,plat,buildnum) is detected, or you can exit the tool. The “count” option serves to print only a summary of such discrepancy instead of one warning per discrepancy. If you have one (testcase,plat,buildnum) with different testcase result values, you use the “teststatusupdate” option to decide which will be used in the HTML output. The options “first” and “last” are self-explanatory. The options “optimistic” and “pessimistic” allows the testcase values that are most optimistic ( pessimistic ) to be used, according to the ordering of STATEARRAY. For example, if you rerun your failed tests several times, you would pick optimistic because if the testcase finally passes, you want to see it as a pass, and not the several failures.
   ---
   # Default assumption: each (testcase,plat,buildnum) is unique.
   # Customize reaction if this is not true
   #    warn  == write warning message
   #    exit  == quit processing
   #    count == no warning per discrepancy but print number of
   #             discrepancies as a reminder
   conflictreaction : count

   # Customize updating html table
   # Example : If STATEARRAY = [P F S A K],
   #       optimistic == lower index of STATEARRAY overrides
   #          typical if testcases have been rerun, so P overrides F
   #       pessimistic == higher index of STATEARRAY overrides
   #       first == first tuple found is accepted
   #       last == last tuple found is accepted
   # uppercase TESTCASEUPDATE for array of valid values
   # lowercase testcaseupdate for option selected
   TESTSTATUSUPDATE:
   - first
   - last
   - optimistic
   - pessimistic
   teststatusupdate: last

   # HTML look
   headerBgcolor: '#9acd32' # lightgreenish
Documentation of source codeOne advantage of using Ruby is that it has a documentation tool called Rdoc that extracts neat and usable source code documentation. In the distribution download, go to doc/index.html to see the Rdoc HTML output. 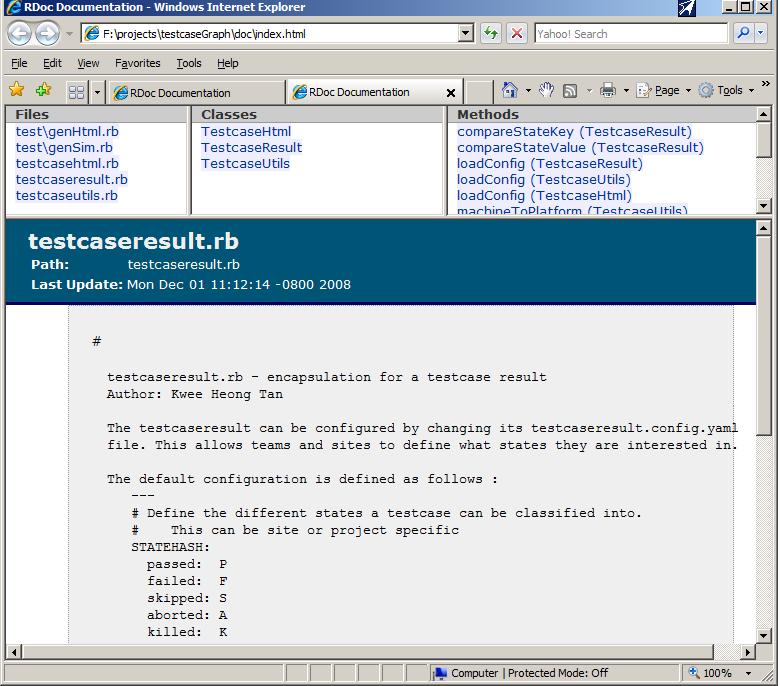
Other usesYou may run the tool once to get an overview of how your testsuite looks, or you may incorporate the tool into your test process for automatic output for every production test runs that you have. The choice is yours. However, there is an additional benefit I would like to mention. The order you run your testcases makes a difference how fast your development team gets feedback. If you run all the tests in the order of number of failures encountered earlier, the more problematic testcases get run first. Conversely, if you run all your “Always Pass” testcases first, your team will have to wait longer for their feedback. Finally, remember you do not need to generate testresult files for every build. You might only generate them for known releases and create the view just for the subset of builds that you are interested in. It's just a tool, use it creatively for your own purposes. Download and have fun! |

|